Payment received. Access goes immediately to the TradingView username you entered at checkout.
Price hunts liquidity.
We map the noise
the hunt.
The CRT Liquidity Framework puts higher-timeframe candle ranges, sweeps, CISD and SMT on one chart — so you stop guessing where the stops are and start waiting where price is forced to go.
Five minutes. One setup.
A visual breakdown of what the CRT Liquidity Framework looks for: the range, the two anchors, the CISD confirmation, what invalidates it, and how to read the Info Table.
5:11 · An analysis tool, not a signal service. Examples are historical and not advice.
More lessons on YouTube.
Same model. Real chart.
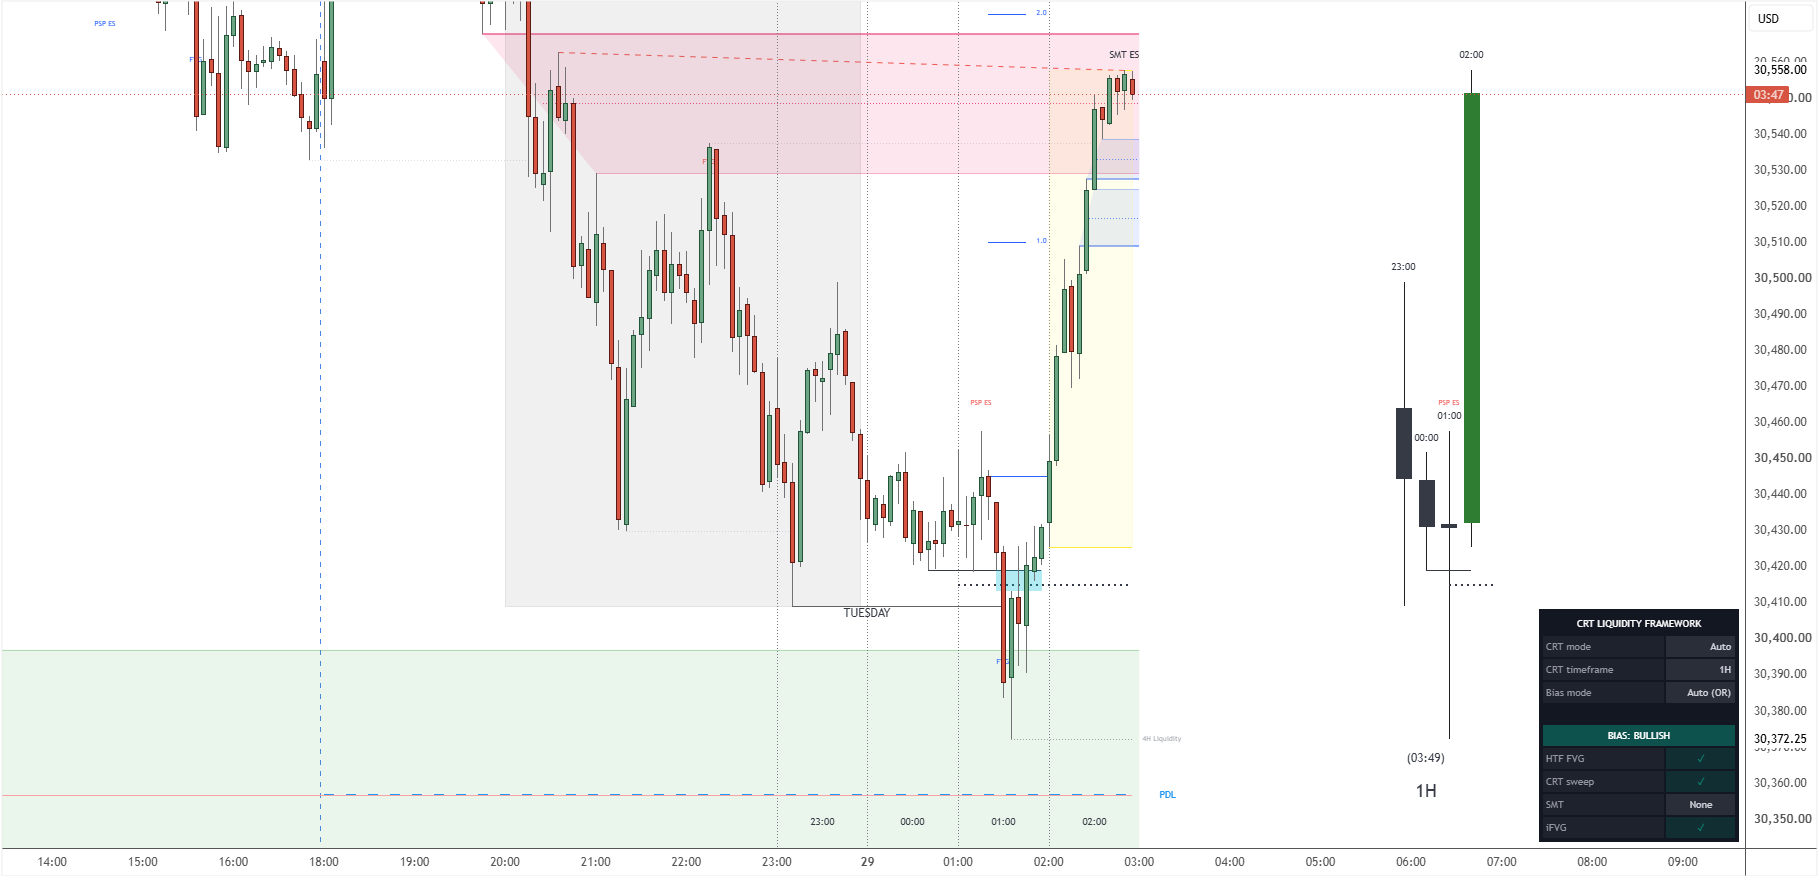
The replay above illustrates the 5m → 1H model. Here's that same model on a real NQ chart, as the indicator drew it.
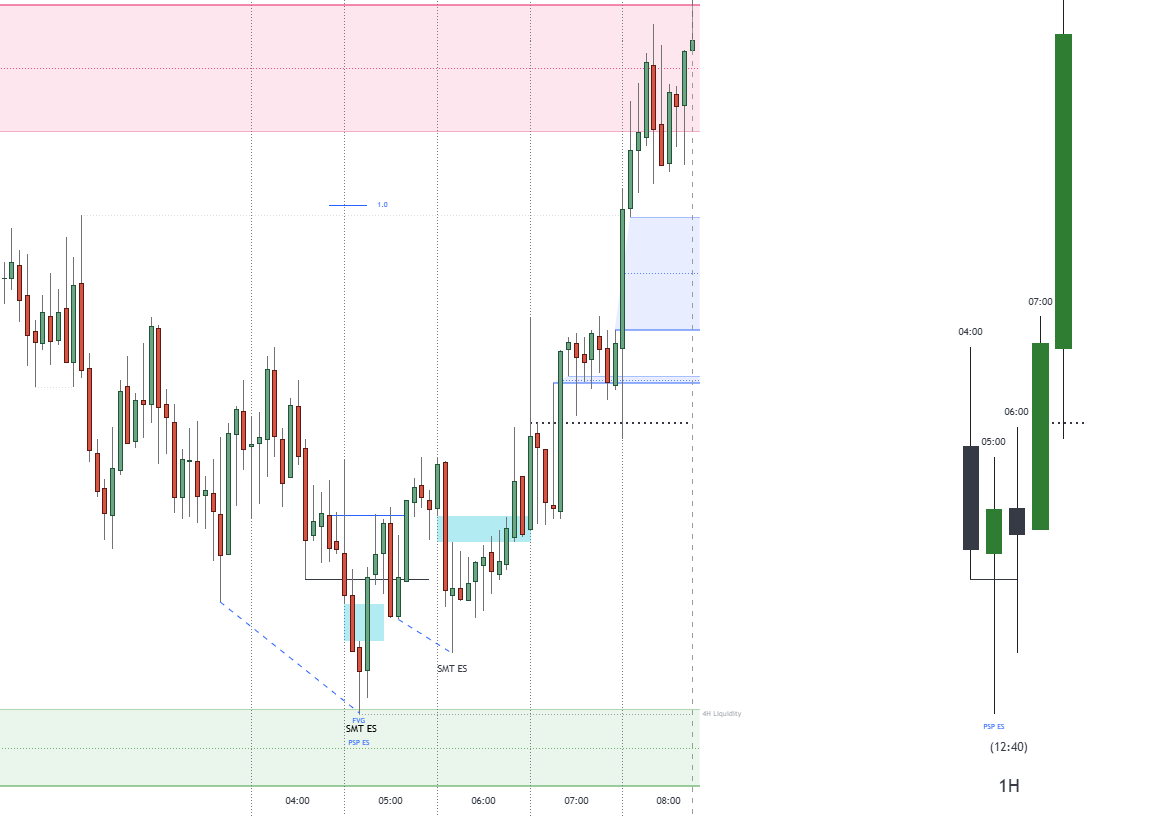
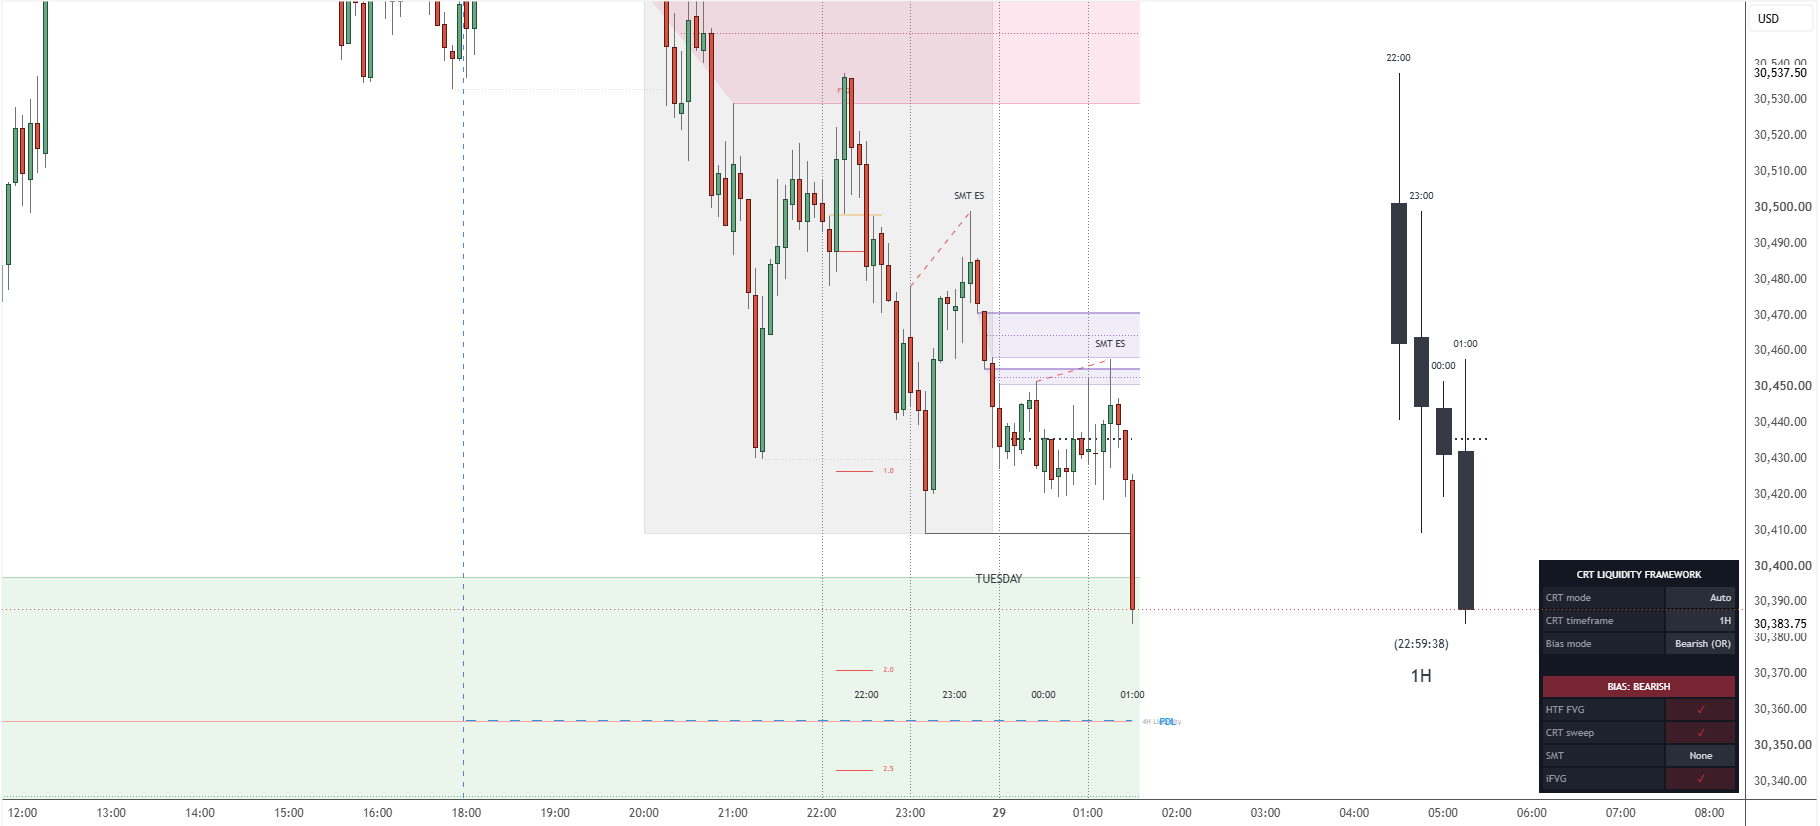
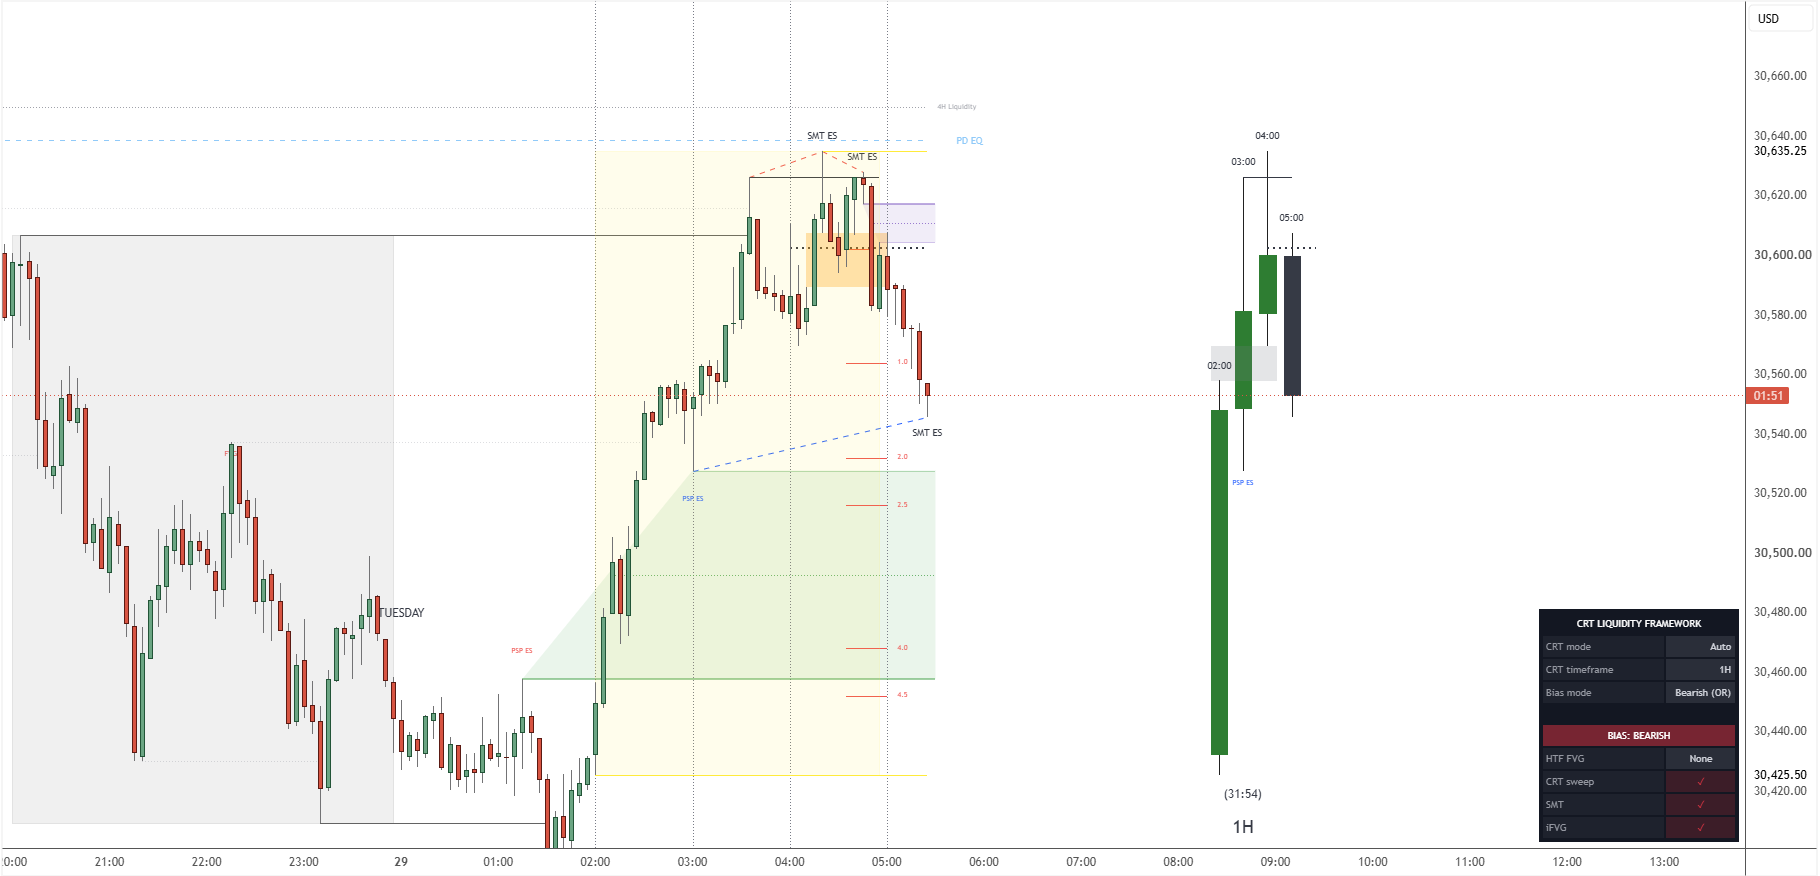
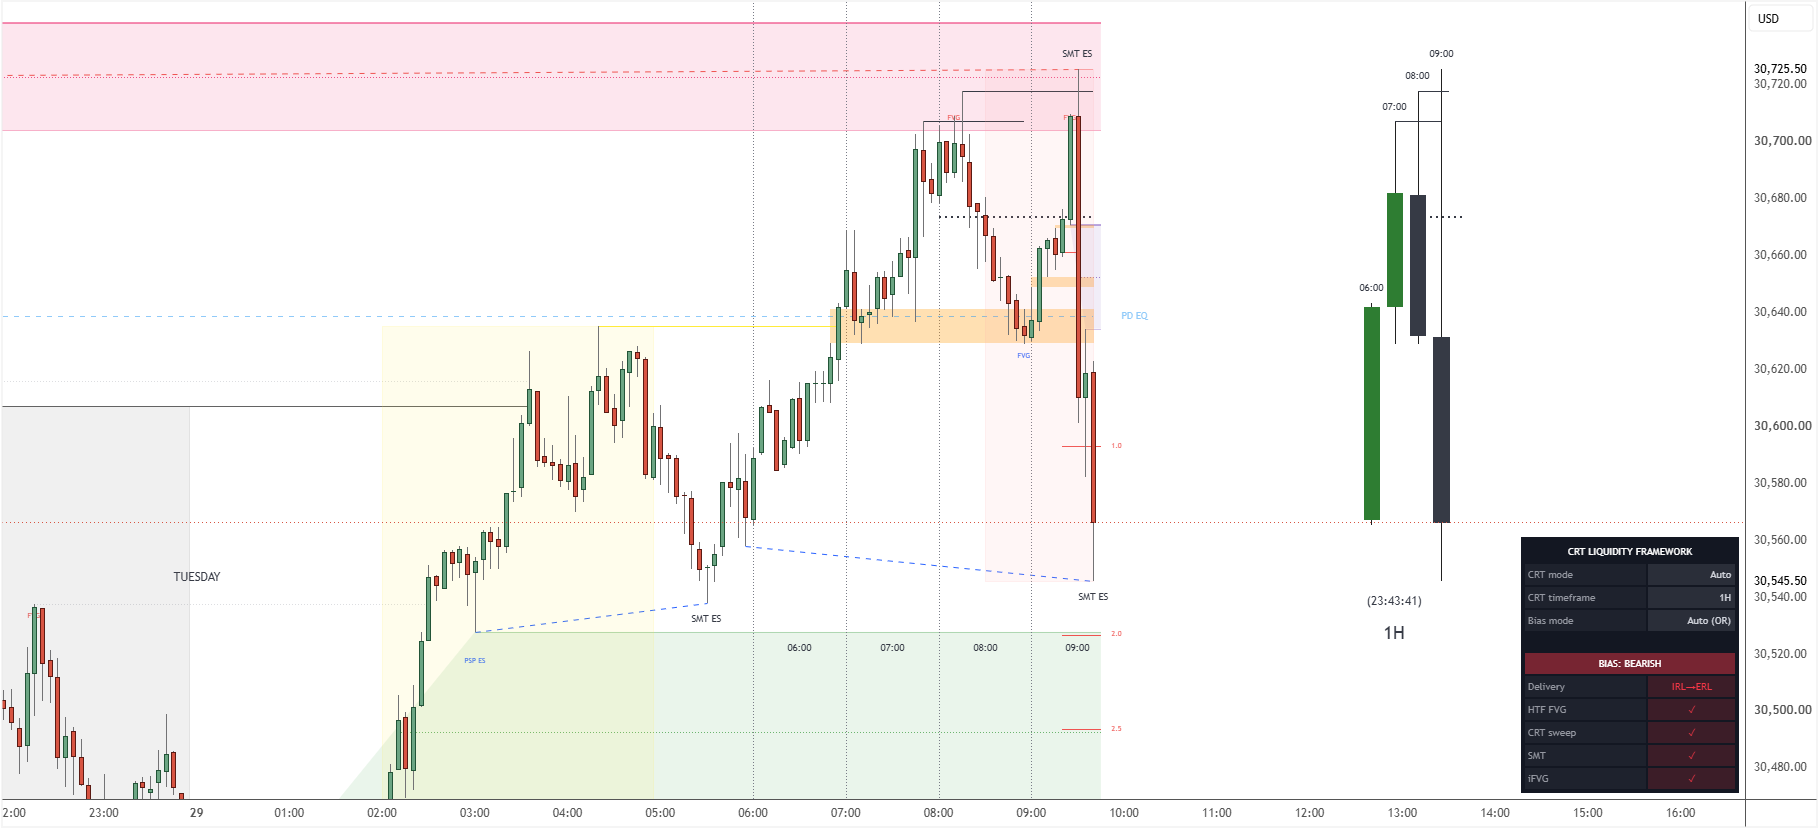
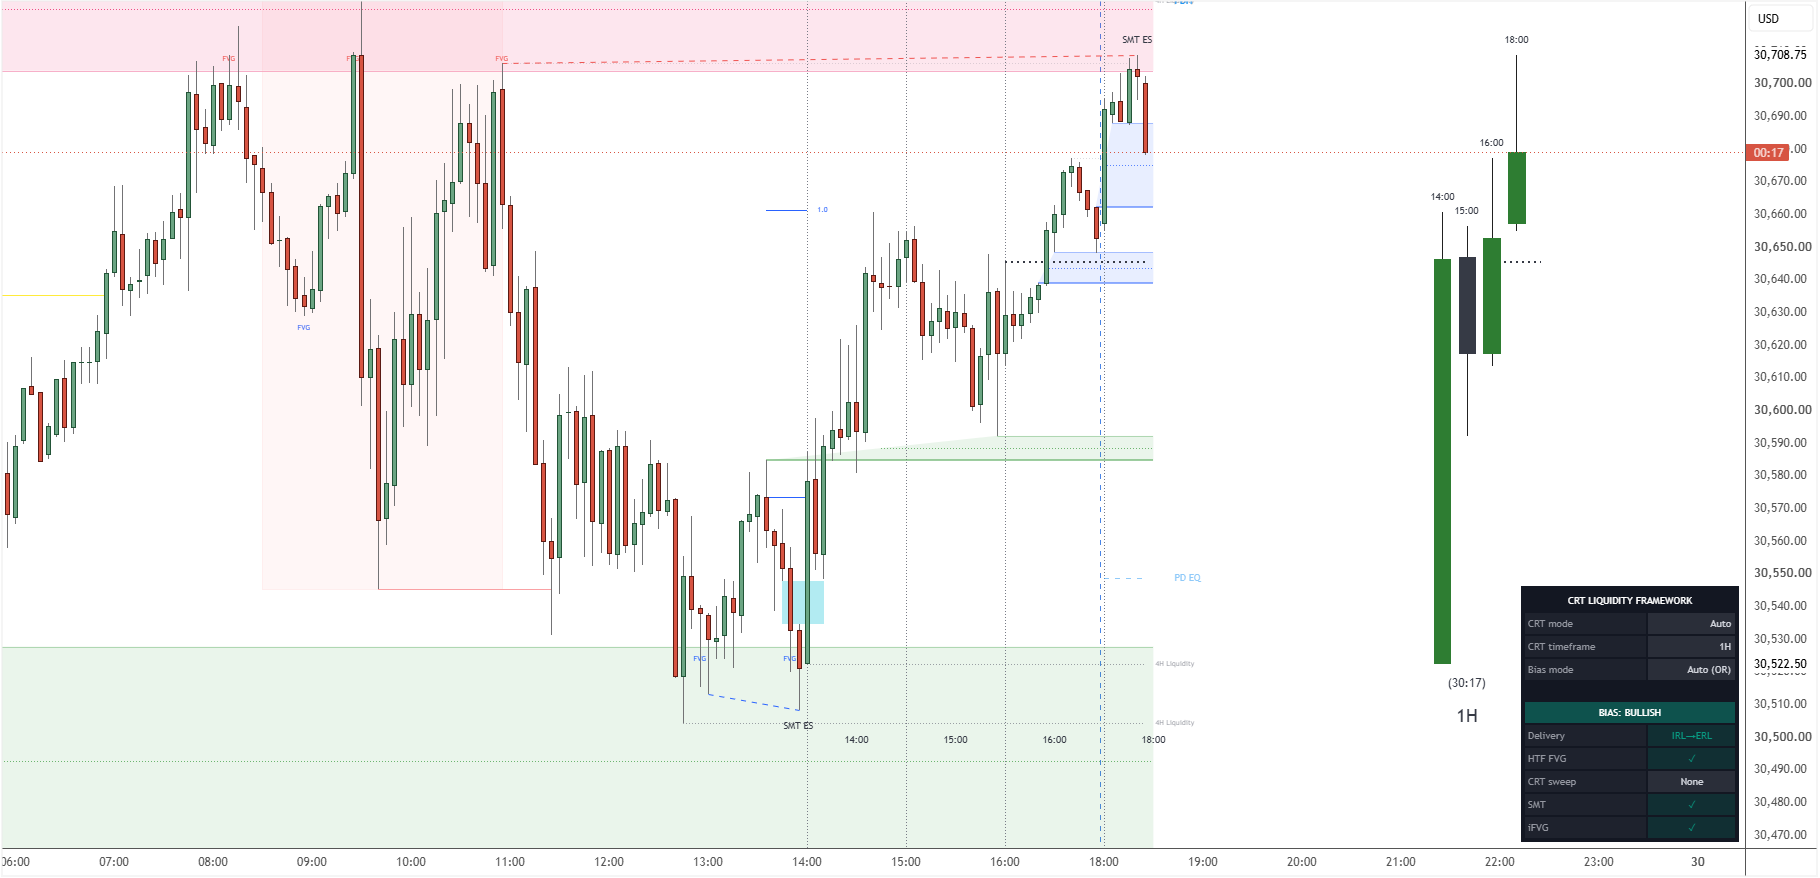
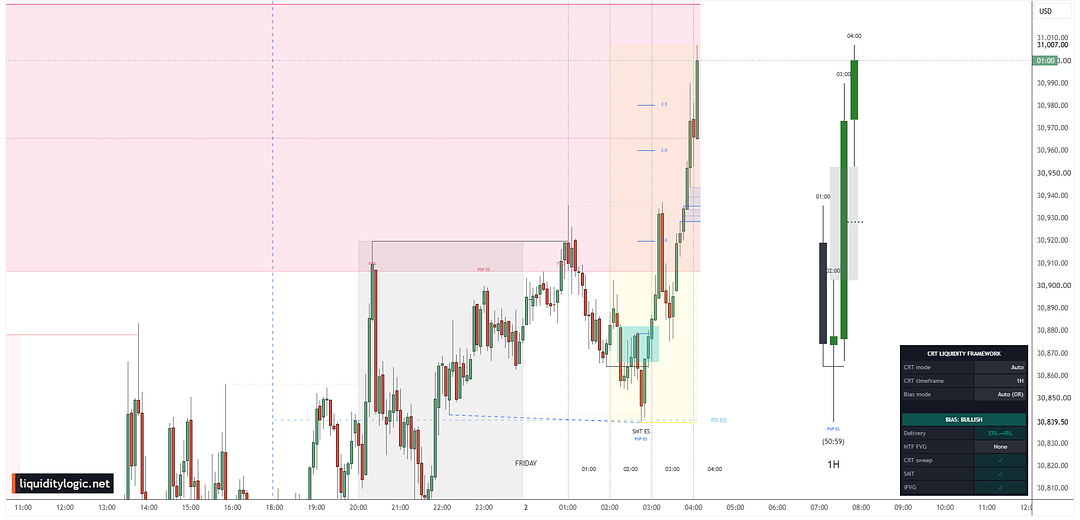
- Sweep into H1 FVGPrice runs the lows into the HTF FVG and reacts with momentum inverting a 5m bearish FVG.
- PSP + SMT against ESNQ makes the lower low, ES doesn't. The indicator flags the disagreement on the sweep candle.
- CISD with FVG retestDelivery flips bullish and leaves a fair value gap that holds on the pullback.
- 1H CRT candlesThe higher-timeframe candles, projected beside price, show the sweep in context.
- Projection 1.0The measured target of the manipulation leg.
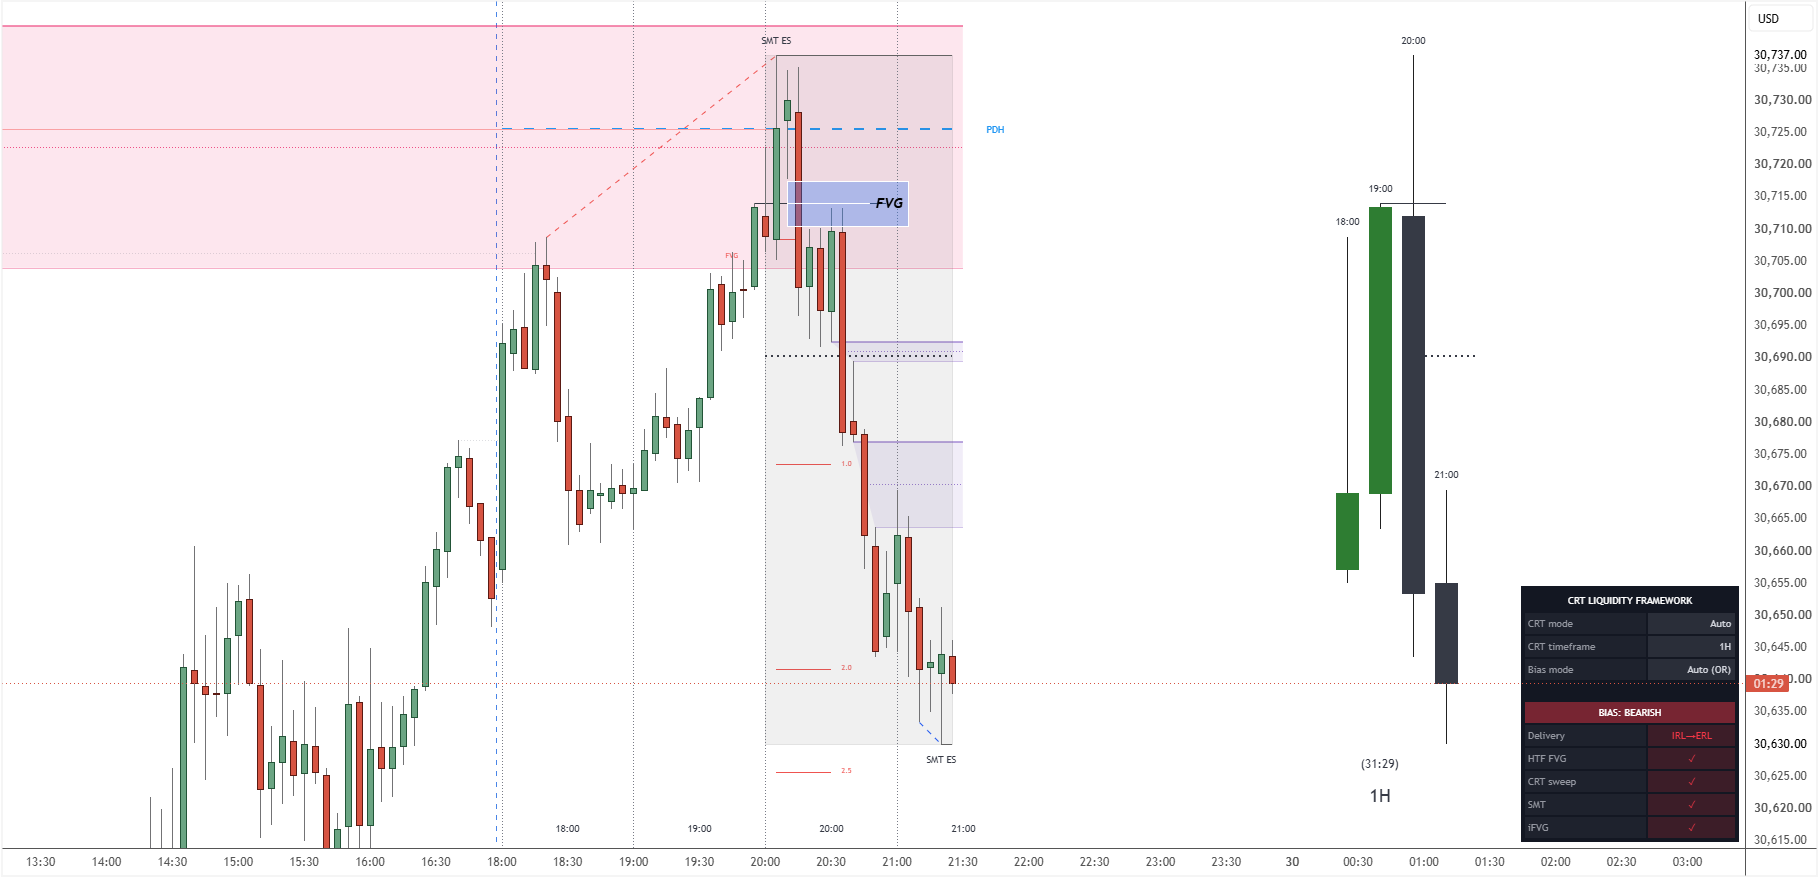
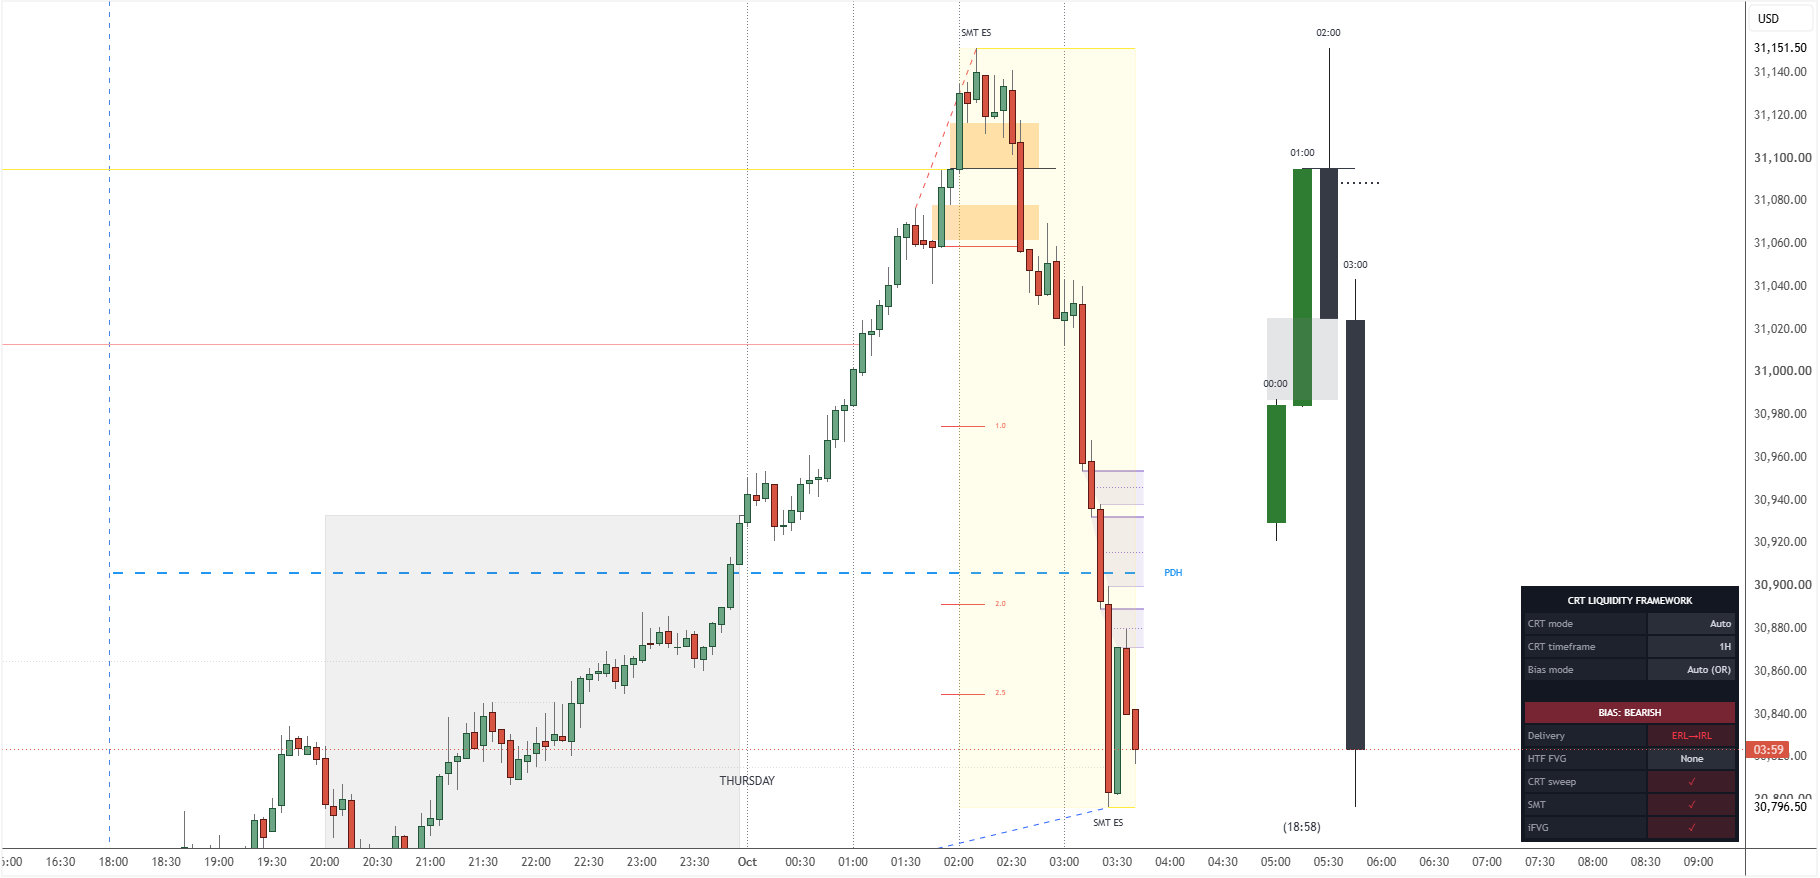
Live examples · unannotated
Same model. Multiple setups.
Price alternates between Internal Range Liquidity (IRL), the fair value gaps inside a range, and External Range Liquidity (ERL), the highs and lows beyond it. It taps one, then runs for the other.
The CRT Liquidity Framework maps both sides on one chart: the gap price taps, the CISD that confirms the turn, and the liquidity it runs to next.
- HTF FVG
- CRT sweep
- SMT
- iFVG
- 1H bias
Three candles. One story.
Every higher-timeframe candle is a range with liquidity resting at both ends. The framework watches which end gets raided — and whether price has the conviction to reverse.
The CRT Liquidity Framework.
Twelve modules that used to live in twelve separate scripts — rebuilt to talk to each other, drawn once, on one chart.
One overlay. Zero chart clutter.
Every module toggles independently. Auto-anchored timeframe pairs mean the right HTF follows you from the 1m to the daily.
HTF CRT candles
Power-of-three candles projected beside price, with countdown and trace lines.
Sweep detection
CRT-timeframe and PO3 sweeps, latest-only mode, with alerts on the close.
CISD engine
Bar-threshold filter, one-active-per-side, auto age-out and invalidation hiding.
SMT divergence
Auto-correlated pair or manual symbols, pivot sensitivity, second-symbol tracking.
Equilibrium
50% of the range, displayed as line or zone — premium vs discount at a glance.
Dual FVG + iFVG
Two independent FVG layers with their own timeframes, plus inversion tracking.
HTF liquidity
Tracks unswept highs and lows on a reference timeframe across your lookback.
PSP
Precision swing points — candles that disagree across correlated assets.
Info table
Bias, active timeframe pair and state in a compact, resizable HUD.
Timeframe alignment
Automatically pairs a higher timeframe for market direction with a lower one for precise entry.
Logic first. Lines second.
No repainting on confirmed bars
Signals are drawn from closed-candle logic. What you see in replay is what you would have seen live.
Rules, not black boxes
Every mark follows a fixed, consistent rule. No black-box "buy" arrows, no curve-fit magic.
Quiet by default
Sane defaults, latest-only modes and age-outs keep the chart readable at 3am on the 1-minute.
Choose your position.
One product: the CRT Liquidity Framework. Invite-only access on your TradingView username. All plans renew until you cancel.
The full CRT Liquidity Framework, month to month.
- CRT Liquidity Framework, every module
- All future updates
- Members group to share setups & settings
Billed $134.97 every 3 months.
You save $15.00- Everything in Monthly
- Save 10% vs. paying monthly
- Time to trade the model across a full quarter
Billed $503.88 every year.
You save $96.00- Everything in Monthly
- Save 16% vs. paying monthly
- A full year to trade the model through every market condition
Before you enter.
How do I get access after paying?
You'll enter your TradingView username at checkout. Access is granted immediately as invite-only scripts. They appear under Indicators → Invite-only scripts.
Do I need a paid TradingView plan?
No. The indicators run on any plan. SMT and multi-symbol features use extra requests, so a paid plan gives more headroom, but it isn't required.
Which markets does it work on?
Anything with clean candles: index futures (NQ, ES), forex, gold and crypto. SMT auto-detects common correlated pairs, or you can set your own.
Does it repaint?
Sweep, CISD and SMT marks are confirmed on bar close. Live HTF candles naturally update while they're forming — exactly like the real higher-timeframe candle does.
Can I cancel?
Yes, anytime. Access runs until the end of your billing period.
Do you offer refunds?
No. All sales are final once access has been granted to your TradingView username, so please review the live examples and FAQ before you buy. See the Terms of Service for details.
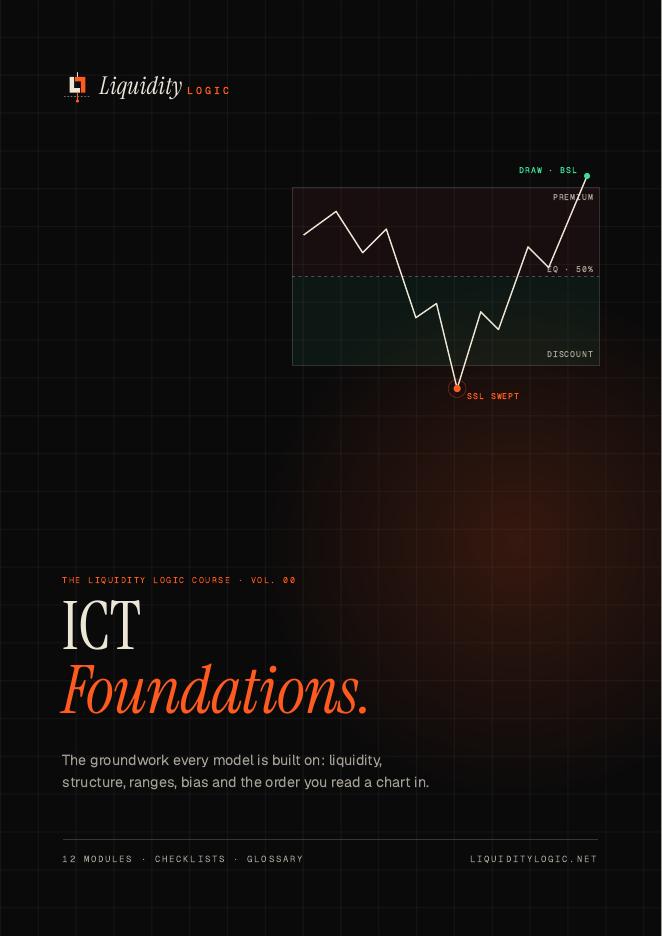
Free course · Vol. 00
Start with ICT foundations.
A free PDF course on the groundwork every model is built on: liquidity, market structure, dealing ranges, bias and the order you read a chart in. Twelve modules, checklists, a glossary and a one-page cheat sheet, straight to your inbox.
- The ICT premise
- Reading a candle
- Market structure
- Swings that matter
- The four phases of price
- Displacement
- Liquidity & the draw
- The dealing range
- Daily bias
- Top-down analysis
- IPDA
- The 5-step framework
Free course · Vol. 01
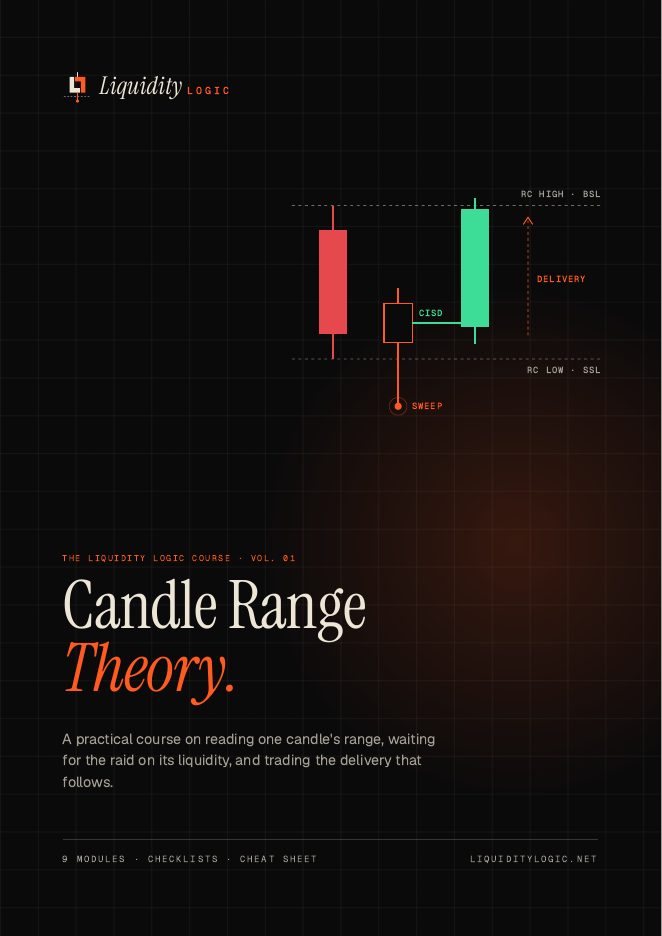
Learn CRT first.
A free PDF course on Candle Range Theory: reading one candle's range, waiting for the raid on its liquidity, and trading the delivery that follows. Nine modules, checklists and a one-page cheat sheet, straight to your inbox.
- What CRT is
- The Reference Candle
- Seek & Destroy
- Executing the setup
- The session playbook
- CRT as Power of 3
- Daily vs Weekly CRT
- Advanced CRT
- Mistakes & cheat sheet
Free on YouTube
Learn it on video.
A new educational video on CRT and ICT foundations is uploaded every day. Subscribe to stay updated.